|
According to Cleveland1, "Data display is critical to data
analysis. Graphs allow us to explore data to see overall patterns and to see detailed
behaviour; no other approach can compete in revealing the structure of data so
thoroughly." Nevertheless, the dominant approach to displaying and reviewing
clinical trial data is through summary tables and listings. The use of such
tables and listings is outmoded and better approaches are available.
Mercury
enables clinical
reviewers to interact with clinical trial data in a way that accelerates the review
process, and enables much deeper understanding.
Mercury is a
browser-based system that is straightforward and intuitive
to use without any requirement for technical skills.
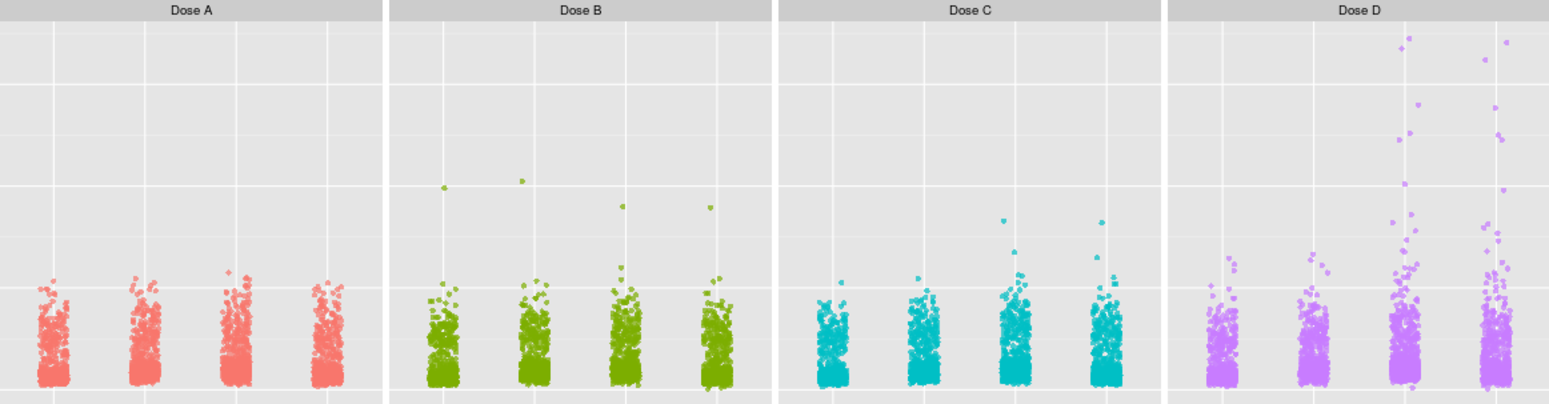
Mercury
presents laboratory and vital signs data as simple scatter plots which
immediately reveal outliers and trends in the data. Each point on the scatter
plot can be clicked by the reviewer, resulting in access to a report
containing all of the data relevant to that patient. In this way,
elevated lab values can be quickly cross referenced with adverse event data,
concomitant medications, medical history, and more.
Mercury
presents adverse event data as a frequency table, the column headings
of which can be clicked to sort the table according to the frequency in that
column. Each cell of the table can be clicked to reveal a list of all the patients
who reported that event in that treatment group. In turn, these patient
identifiers can be clicked to access reports on the individual patients,
enabling immediate cross reference with the lab data, concomitant medications,
and so on.
Experience with a similar data review system, designed by the same author,
received 93% positive feedback from clinical reviewers, found that
the system saved time and money, and resulted in much deeper understanding
of the clinical trial data than was obtained using static tables and
listings2.
Mercury for your
clinical trial can be hosted by Data Clarity Consulting Ltd, password
protected and subject to industry standard encryption for security.
Alternatively, we can deliver the output files to you for hosting on
your company's intranet.
There is no longer a reason to tolerate the difficult and
laborious review of clinical trial data using tables and listings.
Mercury is the solution.
References
1. W. S. Cleveland, The Elements of Graphing Data (Revised Editiion), Hobart Press, 1994
2. H. Southworth, Efficient and Effective Review of Clinical Trial Safety Data Using
Interactive Graphs and Tables, in A Picture is Worth a Thousand Tables: Graphics for
Life Sciences, A. Krause and M. O'Connell (Editors), Springer, 2012
|